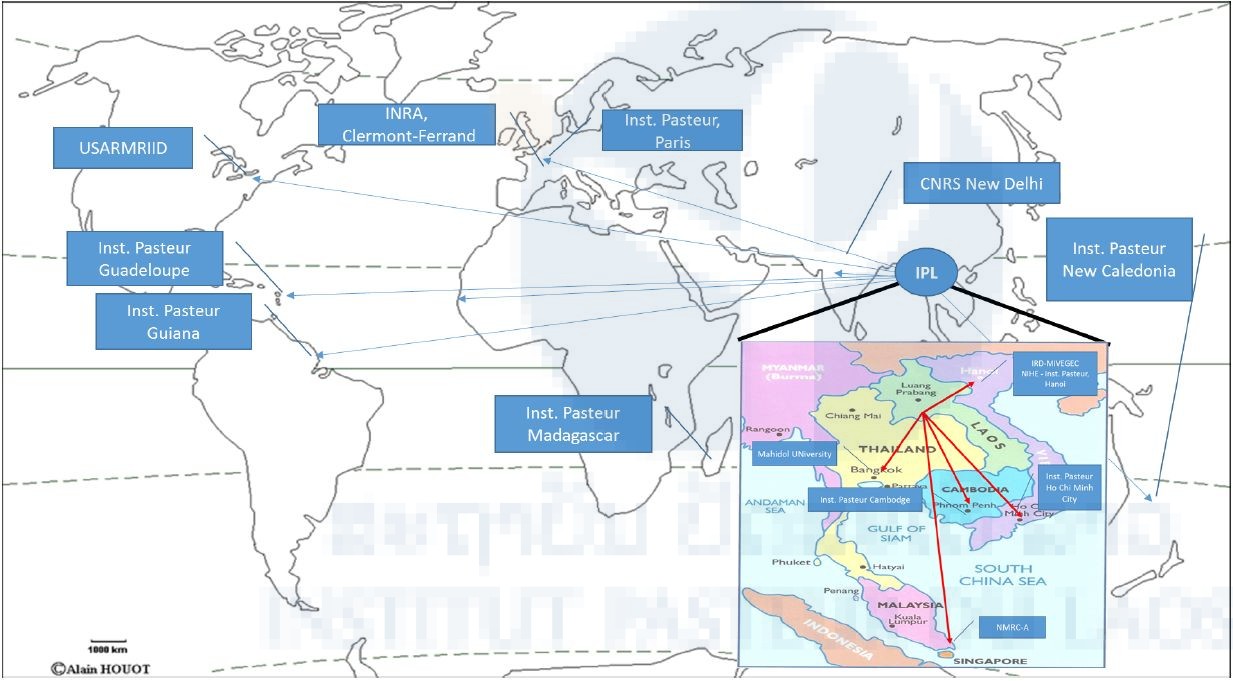
Figure 2:Map of the international interactions 2015-16
« Previous Image | Full-Size Image | Main Gallery Page
Comments are closed.