Figurev422
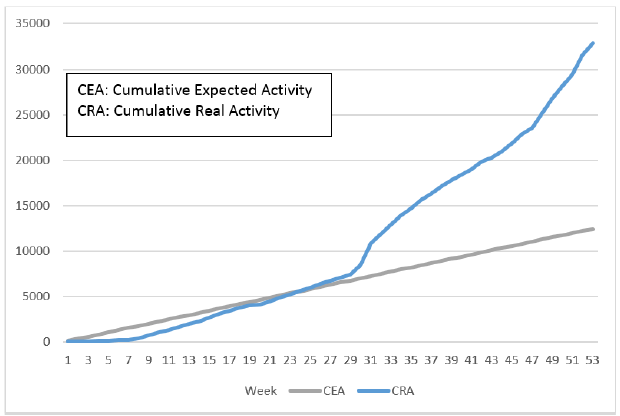
Figure 4. Evolution of the diagnostic activity (RTqPCR
SARS-CoV2) per week (week 1 corresponding to the
start of the project, i.e. the week of October 1). In blue is
the expected volume of activity, in blue the actual volume
of activity
« Previous Image | Full-Size Image | Main Gallery Page | Next Image »