gfigure07-08
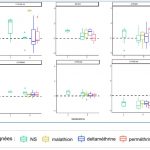
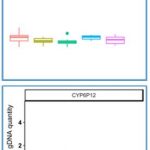
Figure 7: DNAg relative quantity variation for each gene. The black line represent the average CNV for the susceptible Bora strain.
« Previous Image | Full-Size Image | Main Gallery Page | Next Image »
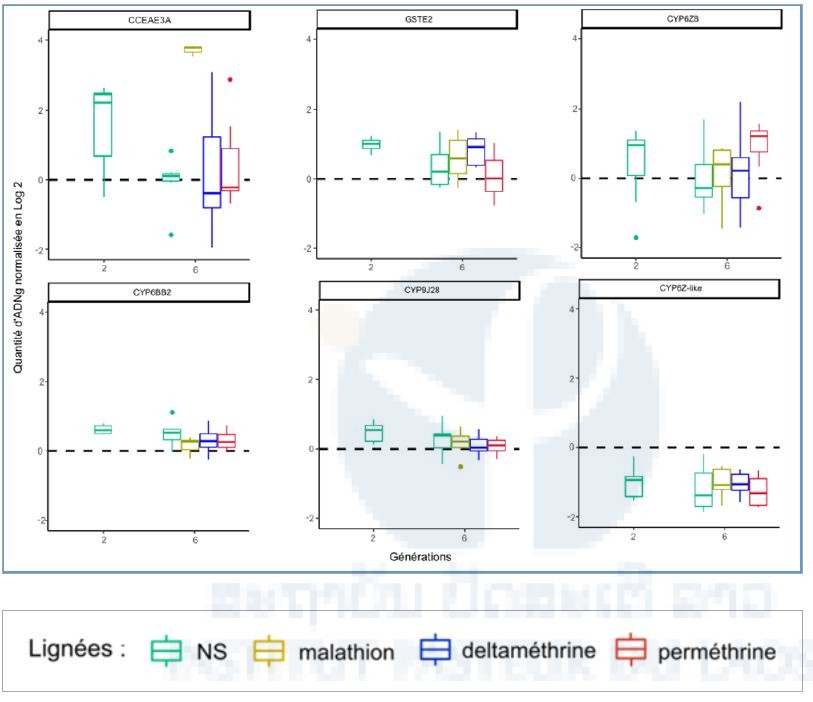
Figure 7: DNAg relative quantity variation for each gene. The black line represent the average CNV for the susceptible Bora strain.
« Previous Image | Full-Size Image | Main Gallery Page | Next Image »