gfigure3-08
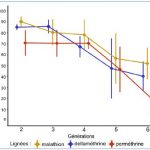
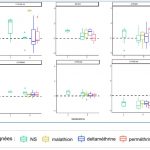
Figure 3: Mortality rates of mosquitoes to the different insecticide over the generations (Fisher test: P<0,05 * compared with G2).
« Previous Image | Full-Size Image | Main Gallery Page | Next Image »
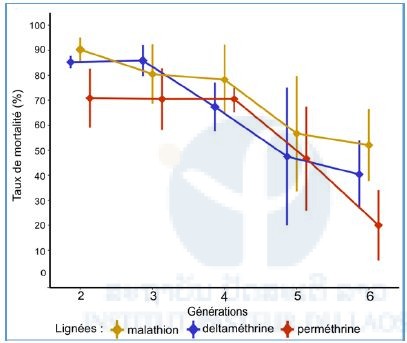
Figure 3: Mortality rates of mosquitoes to the different insecticide over the generations (Fisher test: P<0,05 * compared with G2).
« Previous Image | Full-Size Image | Main Gallery Page | Next Image »