Other Images in this Gallery
-

-
-
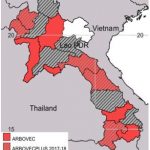
Figure 1. Map showing selected provinces for insecticide resistance monitoring in Laos.
-
-
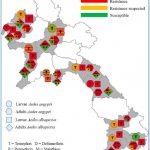
Figure 2. Insecticide resistance distribution of dengue vectors in Laos. (This map also shows result from the ARBOVEC project, see previous IPL annual reports for more details)
-
-
-
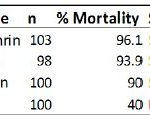
Diagnostic doses of deltamethrin (0.05%), permethrin (0.25%), DDT (4%), and malathion (0.8%) were used.
-
-
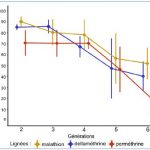
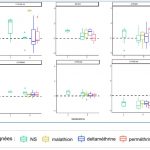
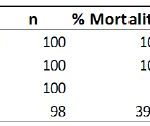
Figure 3: Mortality rates of mosquitoes to the different insecticide over the generations (Fisher test: P<0,05 * compared with G2).
-
-
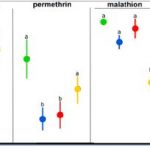
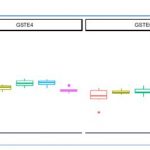
Figure 4. Cross resistance test. A GLMer (binomial family) was performed to analyze these data. Each selected-line is identified by a different color. Different letters indicate significant mortality differences between lines for each insecticide tested.
-
-
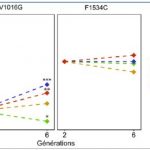
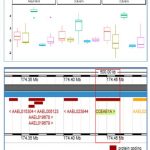
Figure 5: Allelic frequency of kdr mutations (V1016G and F1534C) for the different lineages (Fisher test: P<0.001 ***; P<0.01 **; P<0.05 *). NS: Not Selected.
-
-
Figure 6: Cumulated frequencies of kdr mutations haplotypes (F1534C and V1016G).
-
-
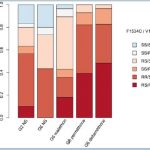
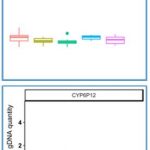
Figure 7: DNAg relative quantity variation for each gene. The black line represent the average CNV for the susceptible Bora strain.
-
-
-
-
-
-
-
-
-
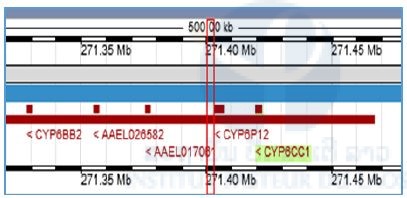
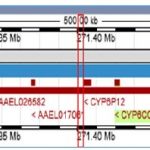
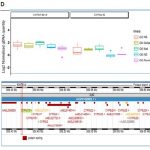
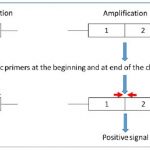
Figure 8. Primer design strategy adopted for developing a new PCR assay to genotype the presence/absence of a genomic amplification associated with insecticid e resistance