gfigure5-08
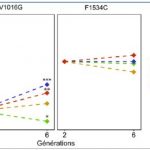
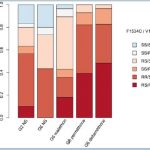
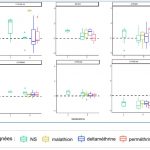
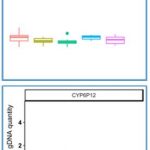
Figure 5: Allelic frequency of kdr mutations (V1016G and F1534C) for the different lineages (Fisher test: P<0.001 ***; P<0.01 **; P<0.05 *). NS: Not Selected.
« Previous Image | Full-Size Image | Main Gallery Page | Next Image »
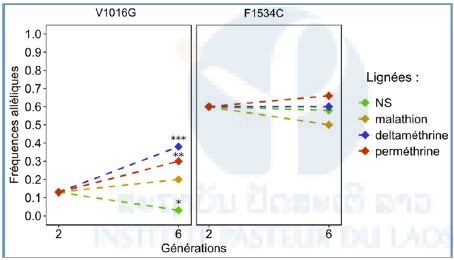
Figure 5: Allelic frequency of kdr mutations (V1016G and F1534C) for the different lineages (Fisher test: P<0.001 ***; P<0.01 **; P<0.05 *). NS: Not Selected.
« Previous Image | Full-Size Image | Main Gallery Page | Next Image »